
When an SRT library carries many streams at once, throughput is not the only measure that matters. Memory use, CPU work and behavior under packet loss matter too. Even a few extra bytes per buffered packet can add up across many connections.
At Robotweax SRT, we evaluate these properties together. One example from our October 8, 2026 measurement series shows how this leads to a concrete improvement: a smaller metadata structure in the send buffer reduced measured process memory by about 33.2 MiB with 32 streams. Throughput remained almost unchanged in the direct comparison. The fix has since been integrated into our development line.
What we measure
Our first metric is the throughput that actually reaches the receiver. A configured sender rate describes the offered load. The result depends on the payload delivered in full and the time needed to deliver it. We also check its contents: a run passes only if the expected data arrives correctly and both endpoints finish successfully.
We relate CPU work to the amount of data transferred. We add the operating system’s user and system CPU time for sender and receiver, then calculate CPU-seconds per delivered Gbit. This shows whether a change needs more compute time for the same amount of payload. It measures CPU work, not the percentage shown by a momentary utilization gauge.
For memory, we sample the RSS of both processes regularly. RSS means Resident Set Size: the resident portion of a process’s memory. Our comparison metric is the sum of the highest observed sender and receiver values. Those peaks may occur at different times. The sum is therefore not a simultaneous peak for the whole system. Kernel socket buffers, for example, are not part of this metric.
SRT counters for loss and retransmission, UDP errors and packets dropped in the simulated network help explain the results. The decisive integrity check is performed on the received payload.
How we make measurements comparable
Before the first run, we fix versions, settings, order and evaluation thresholds. The tested source states are identified unambiguously. We record checksums for source archives, libraries and test programs, and use the same compiler settings for the variants being compared. This makes it possible to determine later which program was actually measured.
Each profile consists of five measurement pairs. Within a pair, the two variants run immediately after one another; their order alternates between pairs. Runs are serial, with a pause between them. This limits interference from concurrent load and test order.
For percentage figures, we first calculate the change within each pair and then take the median of those five changes. The median is less sensitive to a single outlier. Five pairs do not, however, make a statistically assured statement about every possible operating environment. Individual measurements are retained for analysis. Failed cases are documented with their errors, not replaced by more successful substitute runs.
In this series, we flag more than 10% throughput loss, more than 15% additional CPU work per Gbit, or more than 15% additional RSS as a notable regression. These are criteria set in advance for our lab analysis.
Which load profiles we test
The series includes one stream at 50 Mbit/s, as well as 32 parallel streams with 320 Mbit/s or 2 Gbit/s of total offered load. Clean profiles are supplemented with simulated network conditions: light impairment with 20 milliseconds of delay, 5 milliseconds of jitter and 0.1% packet loss, and stronger impairment with 80 milliseconds of delay, 20 milliseconds of jitter and 1% loss. Configured SRT buffer latency is chosen for each profile and held constant within each comparison.
Other profiles combine AES-GCM encryption with FEC, or forward error correction. We also compare the same candidate with optional session authentication off and on. This lets us assess the cost of a protection feature separately from the difference between two library versions.
This example comprises 120 regular measurement cases: 70 comparing against an older reference state of our own library, 20 with session authentication off/on, and 30 directly comparing the memory fix with its immediate predecessor.
From a memory finding to a code change
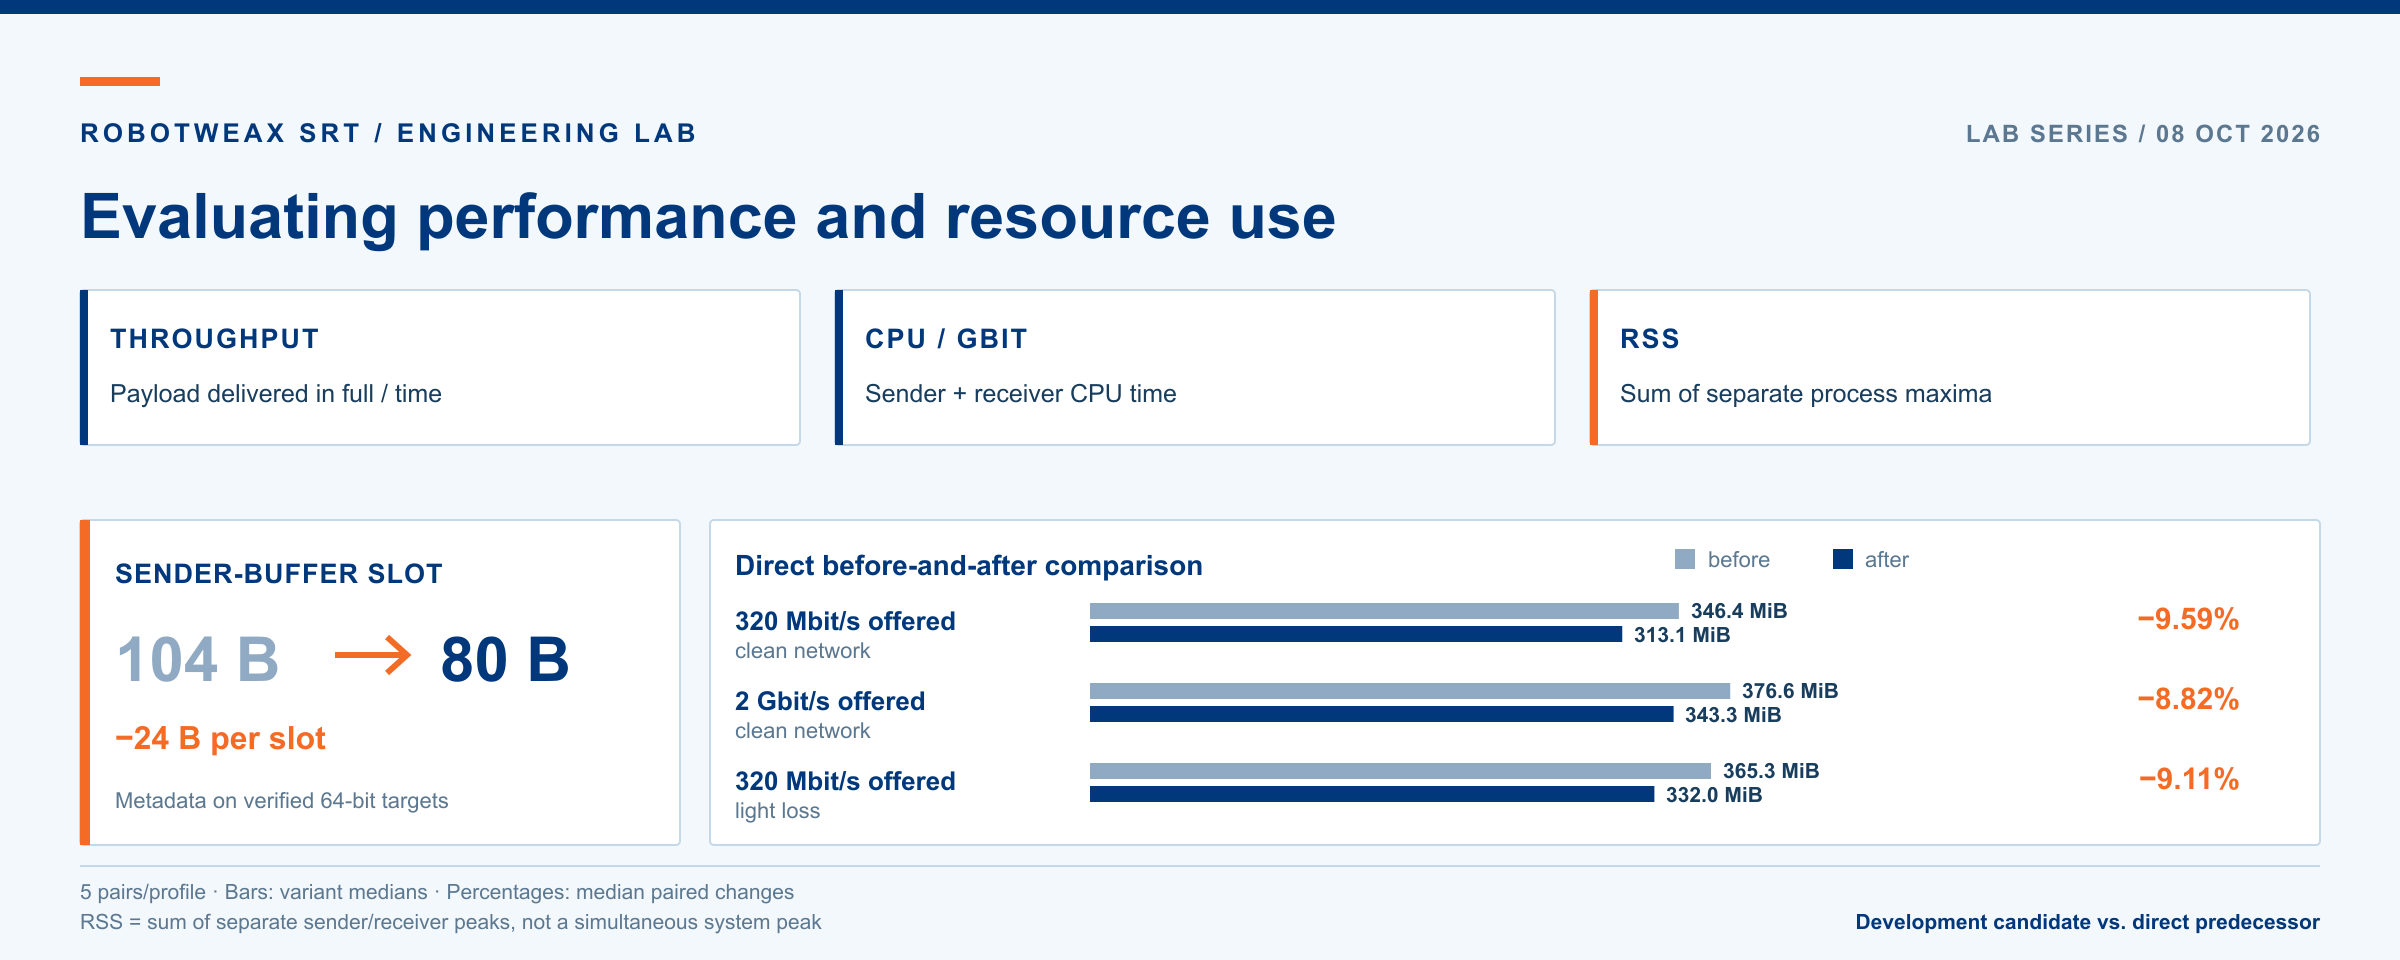
An earlier comparison had shown a notable RSS increase. During the investigation, a metadata structure in the send buffer stood out: it occupied 104 bytes per slot on the verified 64-bit targets. A slot manages information for one packet in the send window.
The structure reserved space both for timestamps belonging to a still-active packet and for information about a packet that had already been dropped. These states are mutually exclusive. We could therefore share their storage and arrange the remaining fields more efficiently. The structure shrank from 104 to 80 bytes, saving 24 bytes per slot.
Transitions between the states remain explicitly defined and tested. Window sizes, full-width timestamps and counters, payload buffers, retransmission budgets and the public C interface remain intact. A compile-time check protects the new size budget. Regression tests cover copying, partially acknowledged messages, sequence-number rollover, expiration and repeated slot reuse, among other cases.
What the direct comparison shows
To isolate the effect of this change, we compare the candidate with the immediately preceding development state. With identical configurations, the results are:
| Profile with 32 streams | RSS before | RSS after | Median of paired RSS changes |
|---|---|---|---|
| 320 Mbit/s offered, clean network | 346.4 MiB | 313.1 MiB | −9.59% |
| 2 Gbit/s offered, clean network | 376.6 MiB | 343.3 MiB | −8.82% |
| 320 Mbit/s offered, light packet loss | 365.3 MiB | 332.0 MiB | −9.11% |
The RSS columns show the median for each variant. The percentages come from the five individual measurement pairs and can therefore differ from the ratio of the two column medians. MiB means mebibytes; one MiB is 1,048,576 bytes.
Across all three profiles, measured memory use falls by approximately 33.2 MiB. That is consistent with the expected saving from the smaller slot layout. CPU work per Gbit rises by about 0.91% in the least favorable of these paired comparisons. The largest throughput decrease is about 0.10%.
The additional comparison with an older reference state of our library answers a different question: how does the current development state compare overall with that state? Across the seven profiles without session authentication, RSS overhead is now about 2.2% to 4.94%. CPU work per Gbit rises by no more than about 4.32%, and the largest throughput loss is about 0.23%. All values remain below the previously defined regression thresholds.
Session authentication, evaluated separately, increases RSS by about 0.24% to 0.27% and CPU work per Gbit by 4.35% to 5.80% compared with the same variant without that feature. Such additional costs also belong in a feature evaluation.
How we test healthy streams under impairment
Another test examines two connections on the same UDP listener. One connection deliberately faces unfavorable conditions and repeated NAKs. NAKs are feedback requesting retransmission of missing packets. Meanwhile, the healthy connection should continue to deliver its data reliably.
We test window sizes of 8,192 and 65,536 packets, with control cases without a NAK flood and cases with 5,000 NAKs per second. Alongside the payload, we check whether the planned flood was actually offered and processed by the sender.
The candidate passes all 20 of its own cases; the healthy stream reaches approximately its intended 50 Mbit/s. The older reference state passes 15 of 20 cases. Its five timeouts with the large window under flood load remain part of the result. We do not report relative performance figures for these incomplete comparison pairs.
How we validate the measurements
Before performance analysis, the change passes functional checks. In this example, all 76 CTest checks pass in both the Debug build and the AddressSanitizer/UndefinedBehaviorSanitizer build, as do 783 Python tests. Another 14 scenarios check interoperability with a prebuilt Haivision SRT 1.5.7 reference program. That reference test checks cooperation between implementations; the performance comparisons use only states of our own library.
All 120 regular measurement cases then pass independent checks of payload integrity, checksums, tested program states and restoration of the network configuration. The analysis can be reproduced identically from the archived raw data. The required GitHub CI gate for the tested PR state is green; some optional jobs were skipped as configured. The send-buffer change is publicly traceable.
What these results mean for deployment
The measurements come from a Linux lab on ARM64 with four virtual CPUs and six GiB of memory. Sender and receiver communicate over loopback; delay and loss are simulated. The profiles use ten seconds of offered sender load. In the profile offering 2 Gbit/s, the receiver actually reaches approximately 1.7 Gbit/s.
This environment is suitable for exposing resource differences under controlled conditions. A specific deployment also requires evaluation on its own hardware, network interfaces, stream configuration and run durations. This short lab series is not an approval for every production environment.
The memory fix illustrates how we evaluate optimizations: we connect a concrete finding in the code to a direct before-and-after comparison, verify correct delivery, and consider additional protection features and impairment cases. That lets us report a saving of approximately 33.2 MiB while stating the conditions under which it was measured.